Dark Pools & Alternative Trading Systems
Separate US trading-venue rules from order visibility, trace two hypothetical executions, and understand what dark-pool data can and cannot reveal.
Written by James Lipyeat · Founder, Ironclad Research
Reviewed 9 October 2026 · Editorial policy
Before this, read
What you will learn
This lesson explains US equity-market structure. The term alternative trading system, or ATS, has a specific place in the United States regulatory framework. Other countries have their own categories. A reader in London or Berlin may encounter a US-listed share trading through this system, but should not apply its legal terminology automatically to a local venue.
The central distinction is between what kind of venue something is and what information it displays. An ATS is a regulated trading arrangement. A dark pool is commonly understood as a venue whose trading interest is not publicly displayed before execution. Neither label, on its own, tells you whether a particular order will fill, whether its price will be favourable, or why someone is trading.
By the end, you should be able to classify an execution destination, distinguish pre-trade from post-trade information, calculate a blended execution price, and explain why venue-volume statistics cannot serve as a buy or sell signal. Start with exchanges and trading venues if order books and routing are unfamiliar. All prices and quantities below are invented teaching examples, excluding fees unless stated. This is education, not a recommendation to trade or use any venue.
Two labels, two different questions
In the US framework, an ATS can operate under an exemption from registration as a national securities exchange, subject to the relevant requirements, including broker-dealer registration and Regulation ATS. It is not simply an exchange with a different brand name. The SEC's guide describes this framework; the applicable requirements depend on the system and the securities it trades. Source: SEC, Guide to Broker-Dealer Registration, section G; verified 9 October 2026.
"Dark" concerns the visibility of trading interest before a match. A public order book might show an offer to sell a quantity at a particular price. A dark pool does not expose that interest to the public in the same way. That difference does not mean there is no matching process, no execution record, or no regulatory oversight. Source: FINRA, Where Do Stocks Trade?, updated 17 July 2024; verified 9 October 2026.
The regulatory definition of ATS does not define the category by darkness: it addresses the system's market functions and limits on its subscriber-rule and disciplinary role. That is the reason to inspect visibility separately, rather than infer it from the acronym. This distinction is about definitions, not a claim about the current number of displayed or non-displayed systems. Source: 17 CFR 242.300(a), current eCFR text; verified 9 October 2026.
This is easiest to understand by keeping three questions separate: where does the instruction go, what can other people see before it executes, and how is the resulting trade reported? Answering the first does not automatically answer the other two. A useful description specifies all three instead of treating the phrase “off exchange” as a complete explanation.
Off exchange is a broader category
FINRA distinguishes exchanges, ATSs and off-exchange market makers when explaining where US stocks trade. A dealer may execute against its own account without that trade being an ATS match. Consequently, adding up every off-exchange execution and calling the result “dark-pool volume” mixes different activities. Source: FINRA, Where Do Stocks Trade?; verified 9 October 2026.
Suppose a fictional report contains 12,000 shares executed through ATSs and 18,000 through non-ATS dealers. The off-exchange total is 30,000. The ATS portion is 40% of that total: 12,000 / 30,000. Describing all 30,000 as ATS volume would overstate the category by 18,000 shares. Even the correctly labelled 12,000 does not establish that every underlying order used the same display or matching arrangements.
A denominator also matters. If the same security traded 100,000 shares across all destinations, the ATS share of total market volume would be 12%, not 40%. Both percentages can be calculated correctly while answering different questions. A chart without a clear denominator invites an interpretation its numbers cannot support.
This distinction carries into language about buying and selling. Every executed share has a purchaser and a seller. Volume alone does not tell you whether either side is opening an investment, closing a position, hedging another exposure, or carrying out a client's instruction. The venue label cannot recover those missing facts.
Why avoid displaying an entire order?
Consider a hypothetical fund that wants to buy 20,000 shares. If it immediately displays that complete intention, other participants can see an unusually large buyer. They may revise their orders for many reasons, including a changed assessment of available supply and demand. The fund might therefore explore a matching process that does not display the whole instruction publicly.
That is an information trade-off, not a promise of a cheaper purchase. The other side might never arrive. Only a small part might execute. A price available now could disappear while the instruction waits. And information may still emerge through repeated interactions, completed trades or disclosures to people who operate the system. “Not publicly displayed” and “known to nobody” are different claims.
For comparison, imagine a seller who values a quick, certain execution more than reducing the amount of interest shown in advance. A route offering possible price improvement but uncertain quantity poses a different problem for that seller. Neither hypothetical establishes which destination is best. They explain why execution has several dimensions: price, size, speed, probability of completion and information exposure.
The teaching point is not that institutions always seek darkness or that small orders always belong on a displayed book. Those are unsupported shortcuts. An order's instructions and the actual opportunities at that moment determine what can happen. The same participant may use multiple types of destination across different orders.
A midpoint is a pricing rule, not an available seller
Suppose a simplified reference market has a bid of $40.00 and an ask of $40.04. Their midpoint is $40.02. A hypothetical ATS can be modelled as matching eligible buy and sell interest at that midpoint. The example assumes its rules permit the match, the reference prices remain current, and both sides accept the resulting price.
The formula is straightforward: ($40.00 + $40.04) / 2 = $40.02. But the calculation supplies no shares. An eligible seller still has to be present. A minimum-size condition, participant restriction or incompatible instruction can prevent a match even where someone else has expressed an interest in selling.
Now let the reference quotes change to $40.06 and $40.10 before a match occurs. The new midpoint is $40.08. If the hypothetical buyer's limit remains $40.05, a match at $40.08 would violate that limit. “Midpoint” does not override the customer's price constraint. The instruction may remain unfilled or be cancelled under its terms.
This is also why an old screenshot proves little about an execution arriving later. It records a particular observation, not an enduring entitlement to a price. A fair explanation identifies the quote timestamp, the match timestamp and the applicable instructions. Without them, apparent discrepancies can reflect different moments rather than an arithmetic error.
Worked example 1: combine two execution paths
A hypothetical broker receives an instruction to buy 500 shares with a $40.05 limit. Assume that, during this example, displayed liquidity is available at $40.04 for all 500 shares. Also assume that an eligible midpoint match is available for 300 shares at $40.02, with no fees or market movement between the two fills.
The instruction first receives the 300-share midpoint fill. The remaining 200 then execute at the displayed $40.04 offer. This is an invented sequence illustrating partial execution; it is not a description of a particular broker's routing policy.
| Part of the order | Quantity | Price | Purchase amount |
|---|---|---|---|
| Hypothetical midpoint match | 300 | $40.02 | $12,006 |
| Displayed offer | 200 | $40.04 | $8,008 |
| Combined | 500 | $40.028 average | $20,014 |
The average is $20,014 / 500 = $40.028. Under the deliberately fixed alternative assumption, buying all 500 at $40.04 would cost $20,020. The modelled difference is $6, or $0.012 per share. It is not a realised return and does not forecast a future saving.
Change one assumption and the comparison changes. If the remaining 200 shares encounter a higher offer after the first fill, the original $6 comparison is no longer the correct whole-order calculation. If the limit prevents completion, only 300 shares have been bought. If one route has additional charges, the comparison must include those charges on the same basis.
Notice the distinction between the price of a successful match and the result of an instruction. A venue could show favourable prices for the matches it completes while leaving a difficult remainder elsewhere. Assessing only completed pieces omits the cost or uncertainty associated with the pieces that did not execute.
Worked example 2: a favourable possibility that never fills
Take a different invented instruction: buy 1,000 shares, with a $25.02 limit, using a midpoint-only route for the first attempt. The reference bid and ask are $25.00 and $25.04, so the calculated midpoint is $25.02. Only 100 eligible sell shares are available there. They execute; 900 remain.
During the waiting period, the reference quotes change to $25.04 and $25.08. The midpoint becomes $25.06, which is above the limit. No further execution is allowed at that price under the stated instruction. The buyer has spent $2,502 on 100 shares and has not purchased the remaining 900.
Calling this a 1,000-share purchase at $25.02 would be wrong. Calling it a guaranteed $20 saving against the original ask would also be wrong: that comparison silently assumes all 1,000 shares executed. On the 100-share completed piece, the difference from the original $25.04 ask is $2. The unfilled quantity must be reported separately.
Now imagine the market instead falls while the instruction waits. The incomplete order might later encounter a lower eligible price. That alternative does not rescue a universal claim either. Waiting creates exposure to changes in opportunity, with outcomes in either direction. A worked example explains how a result arises from assumptions; it cannot establish a permanently superior route.
For a learner examining an execution report, useful fields therefore include requested quantity, filled quantity, remaining quantity, limit, execution prices and timestamps. A single green “price improvement” number, even if correctly calculated, cannot replace the rest of the record.
Pre-trade darkness does not mean no records
Publicly displaying an order before it trades and reporting an execution afterward are different forms of transparency. A venue can withhold its order interest from a public book while its completed trades remain subject to applicable reporting. Do not interpret the absence of visible resting orders as evidence that a transaction has escaped the market's recordkeeping framework.
Equally, a later volume summary is not a live order book. It cannot show that an old purchaser still wants more shares or that an old seller has any remaining inventory. Even perfectly accurate historical totals answer a historical question. They do not turn into executable prices when displayed on a chart.
A useful reading exercise is to identify what a dataset actually measures before explaining it. Is it orders, executions, shares, dollars or number of transactions? Does it combine categories? What period does it cover? Can records be corrected? These questions concern the meaning of the observations, not the attractiveness of the stock.
The related lesson on short-selling data develops the same discipline for measures with different definitions. A reporting label should never be asked to reveal more than the underlying collection method records.
Read venue disclosures as evidence
For ATSs trading NMS stocks, the SEC introduced public Form ATS-N disclosures covering matters such as operations and potential conflicts. Its 18 July 2018 adoption announcement describes why information about the operator, affiliates and handling of trading interest matters. The SEC's current Form ATS-N page describes Rule 304 and links to filings and amendments. This is a dated account of that disclosure framework, not a claim that every type of ATS files the same form. Sources: SEC adoption announcement, 18 July 2018, and Form ATS-N Filings and Information; both verified 9 October 2026.
A learner reading an applicable disclosure can organise the questions into three groups. First, who can interact with the order, including any operator or affiliate activity? Second, how are matching prices, eligibility, priorities and cancellations determined? Third, who can access confidential trading information, and what controls are described? The answers must come from the actual venue's current disclosure, not from a generic description of dark pools.
These questions are not a checklist that certifies a venue as safe. A disclosure describes arrangements and obligations; it does not guarantee operational performance or eliminate conflicts. Comparing what is disclosed with what happened in an execution requires transaction-specific evidence and the relevant rules.
The SEC also states that inclusion on its ATS list is not an approval determination. Being listed cannot support claims that a system is endorsed, that a security is sound, or that an investor will obtain a favourable outcome. Source: SEC, Alternative Trading System List; verified 9 October 2026.
Compare observations without selecting only the winners
Imagine two invented sets of ten instructions, each requesting 1,000 shares. Route A completes 2,000 shares in total at prices that improve on the chosen arrival benchmark by $0.02 per share. Route B completes 9,000 shares at prices improving on the same benchmark by $0.005. Assume comparable instructions and benchmark construction for this arithmetic exercise; real comparisons would need to establish that comparability.
A has the larger improvement per completed share. Its completed quantity is nevertheless only 20% of requested volume, against B's 90%. Multiplying price differences by completed quantities gives $40 for A and $45 for B. Neither total assigns a result to the unfilled shares. Those missing outcomes prevent either number from being a complete measure of the instructions' economic consequences.
Suppose someone publishes only the first column, improvement per executed share, and declares A universally superior. They have selected the successful matches while excluding the much larger incomplete quantity. Publishing only the second column, completed quantity, and declaring B universally superior would also omit relevant price and instruction differences. The exercise demonstrates how two true observations can support an unjustified overall conclusion.
To make the analysis more informative, retain the original requested quantities and describe the remainder. Was it cancelled, sent elsewhere, still open at the end of the observation period, or prohibited from further execution by its limit? A cancellation is not a purchase at zero cost. An open instruction is not a completed investment. Recording those states is part of explaining the result.
Now consider a quoted average trade size. An imaginary dataset with ten executions of 100 shares has the same 100-share average whether those fills came from one 1,000-share parent instruction or ten separate instructions. The average cannot distinguish those underlying stories. Breaking an instruction into pieces changes the execution records without necessarily changing the original objective.
Likewise, a venue's share of reported volume can change because its own activity changes, because activity elsewhere changes, or both. If ATS volume remains 12,000 while total market volume falls from 100,000 to 60,000, its share rises from 12% to 20% without any increase in its absolute volume. Calling that rise an additional 8,000 shares of buying would confuse a percentage-point change with a quantity.
These are measurement exercises, not hidden-market detection methods. They teach a restraint that applies to any chart: define the unit, denominator, observation window and missing information before inferring behaviour. A carefully labelled limitation is more informative than an elaborate narrative that the records cannot establish.
Common interpretation errors
“Dark pools hide all buying” confuses pre-trade visibility with every later reporting process. “All off-exchange volume is institutional accumulation” adds both a participant identity and a motive that the aggregate total does not establish. “A midpoint is always available” mistakes a formula for an executable offer. Each error skips a different missing piece of evidence.
A subtler error is comparing unmatched observations. If one figure uses the quote at order arrival and another uses the quote at execution, a price comparison may include market movement. If one route reports only completed matches while another reports entire instructions, their apparent fill rates may have different denominators. Before judging an outcome, define the measurement consistently.
Another is assuming that non-display resolves all market-impact questions. Avoiding public display can change what other people see, but an actual purchase still transfers shares, interacts with counterparties and may be followed by further activity. The result depends on size, timing and market conditions. No venue label neutralises every source of execution risk.
Finally, venue mechanics are separate from investment merit. A flawless match in a weak company remains exposure to that company. Understanding how an order might execute does not establish why anyone should own the underlying security or predict what happens next.
Check your understanding and continue
Return to the 500-share example. If the midpoint venue had filled only 100 shares, with the remaining 400 at $40.04, the total would be $4,002 + $16,016 = $20,018, giving an average of $40.036. The modelled difference from $20,020 would shrink to $2. Quantity matters as much as the favourable price attached to a single fill.
Now explain the same example without arithmetic: one instruction can travel through multiple destinations; each completed piece has its own price and quantity; the remaining instruction still matters. If you can also say why ATS, dark pool and off exchange are different categories, you have the main conceptual structure.
Next, clearing and settlement follows the obligations created after execution. Liquidity examines depth and the limits of displayed observations. Neither requires treating venue statistics as trading signals.
Source scope and maintenance: US institutional and regulatory descriptions above were verified on 9 October 2026 against the linked SEC, Investor.gov and FINRA materials. Recheck them when Regulation ATS, the applicable disclosure framework or reporting definitions change. No current venue counts, market shares, filing thresholds or provider fee schedules are asserted. The numerical examples and figures are original hypothetical illustrations, not observations of a live market.
Finished this lesson? Track your progress.
Frequently asked questions
Are all alternative trading systems dark pools?
No. ATS is a US regulatory category; dark pool describes a venue that does not publicly display its trading interest before execution. The labels overlap but are not interchangeable.
Is every off-exchange trade a dark-pool trade?
No. US off-exchange activity also includes non-ATS dealer executions. A report must distinguish those categories before its figures can be interpreted.
Does a midpoint order guarantee a better fill?
No. An eligible counterparty and sufficient size must be available. A partial fill, delay, fees or a later price change can alter the result for the whole order.
Does dark-pool volume reveal institutional buying intent?
Not by itself. Executed volume records matched purchases and sales. Venue totals do not identify every participant's motive, portfolio exposure or next action.
Which country's rules does this lesson explain?
The United States. ATS regulation, SEC disclosures and FINRA reporting are US examples verified on 9 October 2026; other jurisdictions use different venue categories and rules.
Key terms
Next lesson
Continue learning
Clearing, Settlement and the Settlement Clock
Related topics
Liquidity & Liquidity Sweeps
Learn the difference between market liquidity and chart-based liquidity sweeps: spreads, depth, price impact, buy-side and sell-side terminology, and what a price chart cannot establish about orders or intent.
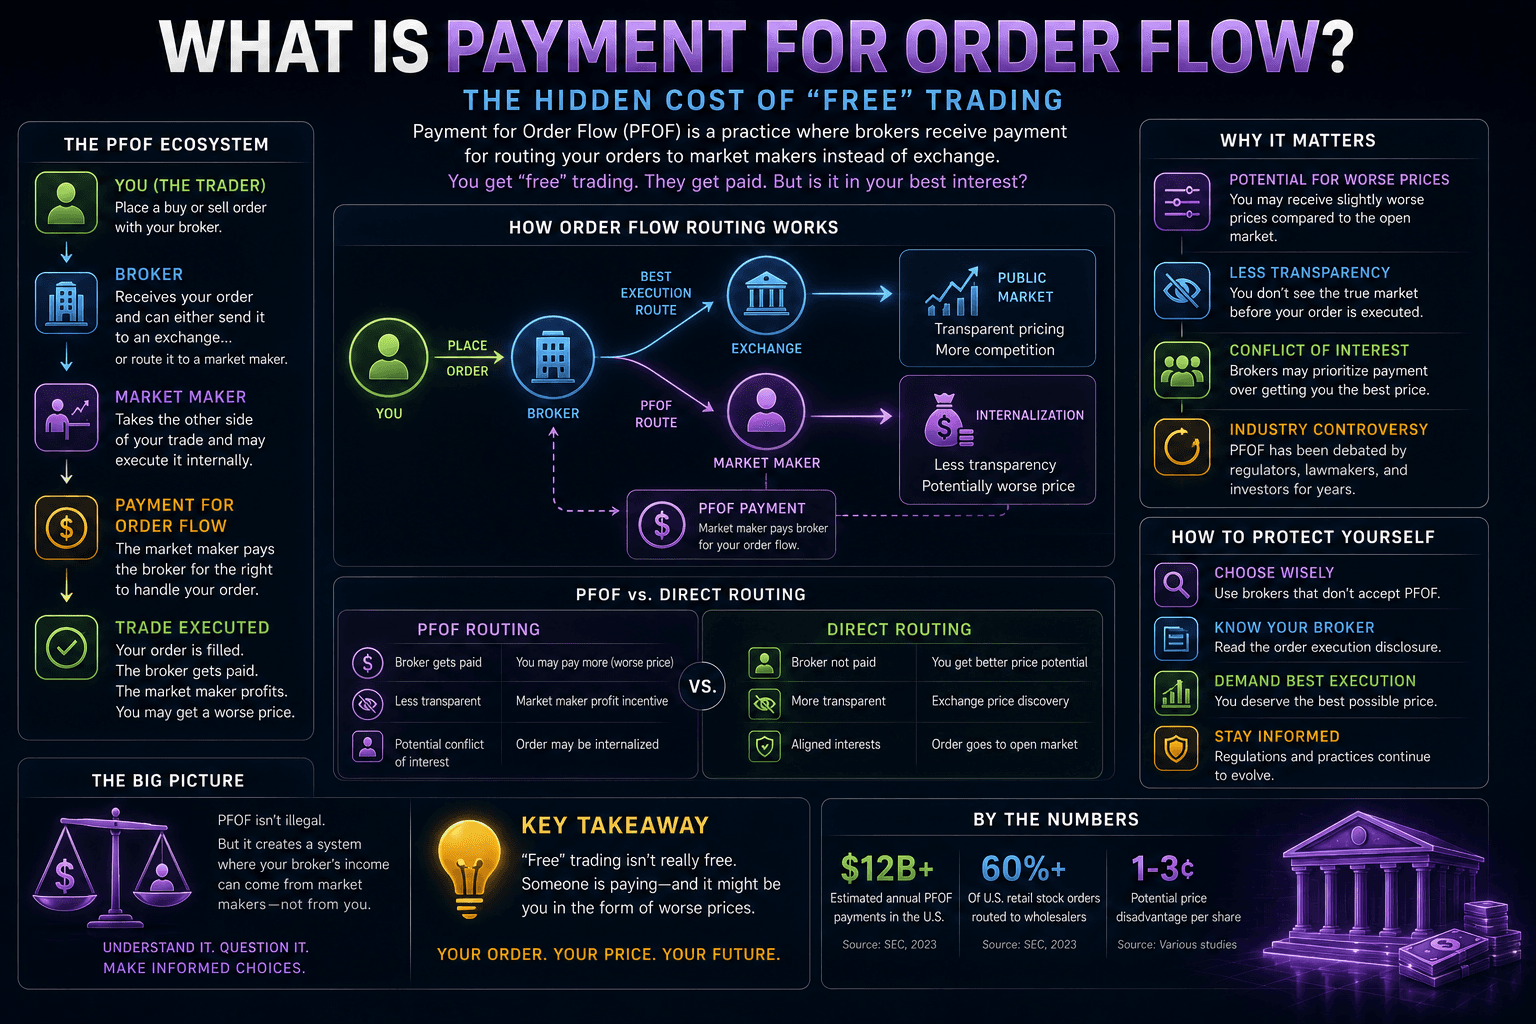
What Is Payment For Order Flow?
A balanced explanation of payment for order flow: how it funds commission-free trading, why market makers pay for retail orders, the conflict of interest it creates, price improvement and the NBBO, and what it means for you.
Reading Short-Selling Data: Short Interest, Short Volume & Cost to Borrow
Three numbers get quoted endlessly to judge how heavily a stock is shorted — short interest, short volume, and cost to borrow — and two of them are constantly misread. Learn what each actually measures, why short volume is NOT short interest, why short interest can legitimately exceed 100% of the float, and why the borrow fee is often the most honest real-time signal of the three.
Ironclad Research provides educational content only. Nothing on this platform is financial advice, a recommendation, or an offer to buy or sell any security. Always do your own research and consider professional advice before making financial decisions.