Market Makers and Liquidity Provision
Understand two-sided quotes, inventory, adverse selection and why the spread is not guaranteed profit, with clearly labelled US venue examples.
Written by James Lipyeat · Founder, Ironclad Research
Reviewed 4 October 2026 · Editorial policy
Before this, read
The service and the exposure
A market maker offers trading interest on both sides of a market: a price at which it will buy and a price at which it will sell, for specified quantities and subject to the applicable rules. By standing between trading interests that do not arrive together, it can make transactions possible without requiring the original buyer and seller to meet at the same instant.
That function creates exposure. If sellers arrive now and buyers arrive later, the market maker may hold inventory while the price changes. The quoted spread is one visible part of this business, but it is not a promise that both sides execute, at those prices, in equal quantities. A dealer can provide liquidity and lose money on the resulting trades.
This lesson builds on Exchanges and Trading Venues. It explains general mechanisms, with NYSE and Nasdaq examples labelled as US market arrangements and checked on 4 October 2026. All numerical examples are invented and exclude fees, financing and hedging costs unless stated. They teach accounting and risk, not expected returns or a strategy recommendation.
Here, market liquidity means the ability to transact a given quantity without a large price concession or delay. It is not a claim that a chart reveals hidden orders or predicts a “liquidity sweep.” The existing Liquidity lesson discusses chart terminology; no familiarity with that interpretation is required here.
Quoting is an offer to transact, not a forecast
Read a quote of $99.98 bid and $100.02 ask from the quoting dealer's perspective. It is willing to buy at the bid and sell at the ask, for the quantities represented by those quotes. A customer selling to that dealer receives the bid. A customer buying from it pays the ask. The spread is $0.04 per share, with a $100.00 midpoint.
These are transaction terms at a moment in time. The ask does not mean the dealer forecasts that the share will rise, and the bid does not mean it forecasts a fall. Quoting both can be part of managing a business that intermediates activity, rather than expressing the directional opinion suggested by either quote in isolation.
Size is part of the offer. A quote for 100 shares is not an offer for a million shares at the same price. A market maker can change price or size as circumstances change, subject to its obligations and the handling of already executable orders. A quote update does not retrospectively change a completed trade.
Some liquidity comes from participants that are not formally designated market makers. An investor's resting limit order can also be available for someone else to trade against. Conversely, a market-making firm may sometimes remove liquidity by executing against someone else's quote. “Liquidity provider” describes what an order does in a particular interaction; “registered market maker” can also describe a formal status.
Keeping those meanings separate avoids counting every bid as a dealer's forecast or assuming that every trade against displayed interest came from an ordinary investor. The order book is an interaction between instructions. It does not label all underlying motives.
Worked example: the spread fails to become profit
Start with a dealer holding no shares. It displays a bid for 100 shares at $99.98 and an ask for 100 at $100.02. A seller executes against the bid. The dealer pays 100 × $99.98 = $9,998 and now owns 100 shares. Only one side has traded; there is not yet a completed round trip.
If an eligible buyer subsequently buys those 100 shares at $100.02, the sale produces $10,002 and the gross difference is $4. That is a possible realised result under the stated sequence, before costs. It is not established at the moment the dealer buys the inventory, because the second transaction has not happened.
Instead, suppose adverse news arrives first. The market moves lower, and the dealer later sells all 100 shares at $99.70. It receives $9,970. The completed result is $9,970 − $9,998 = −$28 before costs. The initial four-cent spread did not protect against a 28-cent loss relative to the purchase price.
Between buying and selling, a mark-to-market estimate would value the inventory at a chosen reference. At a $99.70 mark, its value is $9,970, implying the same $28 decline relative to cost. But a mark is still not necessarily an executable liquidation price for the whole position. A realised result and a valuation estimate should therefore be identified separately.
If a report said only “the dealer earned the four-cent spread,” it would omit the event that changed the outcome. If it said “dealers always lose when prices fall,” it would also overreach: another dealer might have different inventory or hedges. This example establishes the exposure of one specified position, not the aggregate fortunes of an industry.
Worked example: one-sided arrivals build inventory
Now follow a different invented sequence, again beginning with no shares. Three transactions occur: the dealer buys 200 shares at $99.98, sells 80 at $100.02, and buys another 150 at $99.96. Track units first, before attempting to label the result as profitable.
| Event | Inventory change | Ending shares | Cash movement |
|---|---|---|---|
| Buy 200 at $99.98 | +200 | 200 | −$19,996.00 |
| Sell 80 at $100.02 | −80 | 120 | +$8,001.60 |
| Buy 150 at $99.96 | +150 | 270 | −$14,994.00 |
The dealer has traded 430 shares in gross volume, yet finishes long 270 shares. Net cash paid is $19,996.00 − $8,001.60 + $14,994.00 = $26,988.40. Gross activity, net inventory and cash movement describe different aspects of the sequence.
At an illustrative $100.00 valuation for the remaining shares, inventory is worth $27,000. Adding that asset value to net cash movement gives an economic result of $11.60 before costs. At a $99.80 mark, the shares are worth $26,946 and the result is −$42.40. The 20-cent change in the mark changes the result by 270 × $0.20 = $54.
That $54 sensitivity is more informative than simply noticing that some shares were bought at a bid and sold at an ask. The position is still open. A full accounting statement may separate realised gains from unrealised inventory changes using a specified cost convention; this example combines cash and the remaining asset value to make the exposure visible.
The dealer might alter its quotations to encourage inventory reduction or slow further accumulation. For instance, it could make its bid less competitive or offer some inventory at a lower ask. Those are possible mechanisms, not instructions for a trading strategy or a prediction that every firm responds in the same way. Competitors and customers may respond differently from what the dealer hopes.
Gross trading margin is not net business profit
Return to the possible matched round trip: 100 shares bought at $99.98 and sold at $100.02 produced $4 before costs. Suppose, purely for arithmetic, the combined transaction charges for those two fills were $1.20. The remaining amount would be $2.80 before any funding, hedging or operating expenses. These invented charges are not a fee schedule or an estimate of a dealer's economics.
Now imagine a separate hedge cost $3 to enter and unwind. Under those additional assumptions, the combined result would be $4 − $1.20 − $3 = −$0.20 before other expenses. This does not establish that hedging was a mistake; it illustrates why a gross spread figure cannot answer a question about net profit or about the risk avoided by a hedge.
Different accounting questions require different information. Trading revenue, marked inventory changes, transaction costs and the expenses of running the business do not all appear in the same quote. A claim that a dealer “makes four cents on every share” should therefore identify which trades, which period and which costs it includes. Without those boundaries, the apparently simple statement cannot be checked.
Inventory risk and adverse selection are distinct
Inventory risk is exposure to price changes while a position is held. The first example lost money after a purchase because the dealer was long during a decline. That exposure exists even if the original seller had no special information and acted for an unrelated reason.
Adverse selection concerns which trades occur against a quote. A quote can be especially attractive to someone whose information or speed makes the quoted terms favourable relative to the emerging market value. The dealer may be more likely to sell just before a rise, or buy just before a fall, than a naive assumption of balanced random arrivals would suggest.
Imagine a dealer's ask remains $100.02 while public news causes other participants to value the share around $100.40. A fast buyer can find the unchanged ask attractive. After selling, the dealer cannot assume it can replace those shares at its old bid. The problem is the relationship between execution and changing information, not merely the existence of a spread.
This does not require insider trading or a dealer knowing each customer's identity. Different participants can process the same public information at different speeds. Equally, observing a price move after a fill does not prove that the counterparty possessed superior information: chance and unrelated subsequent events can produce the same pattern.
The distinction is useful when reading claims about “toxic flow.” Such language often refers to trading that is costly for a liquidity provider because executions systematically precede unfavourable price changes. It is an economic description, not by itself a legal allegation against a customer. A particular accusation needs evidence beyond a chart and an unhappy fill.
Why a spread changes
A spread can reflect uncertainty about value, the cost of carrying inventory, competition for orders, transaction charges, and the resources needed to operate. These influences do not add up to a fixed published formula. Their relative importance differs across securities, firms, venues and conditions.
Consider two snapshots with a four-cent spread. In the first, 1,000 shares are displayed on each side. In the second, only ten are displayed. A one-share transaction might see similar quoted prices, while a 500-share instruction could encounter very different depth. Equal spreads do not establish equal liquidity.
Now imagine a spread widens to eight cents but almost no customer trades occur. Multiplying eight cents by imagined volume would not measure revenue. Even actual volume is insufficient without identifying which prices the dealer obtained, what inventory remained, and how that inventory changed in value.
This is why the spread diagram uses categories rather than a pie chart. There is no evidence here for assigning 40% to inventory, 30% to information and 30% to expenses. Decorative precision would turn an explanatory model into a fabricated measurement. A proper empirical decomposition would require data and a clearly specified method.
Hedging changes exposure; it does not erase uncertainty
A dealer may offset some inventory risk with another transaction. Selling an equivalent position can reduce direct exposure; using a related instrument can reduce some shared market exposure while leaving differences between instruments. The details depend on what is held and what is available to hedge it.
Suppose the dealer in the inventory example holds 270 shares of a fictional company and uses a broad-market instrument as a partial hedge. A general market fall might affect both positions, but company-specific news can move the share differently. The remaining mismatch is a reason that “hedged” does not mean “unable to lose.” No hedge ratio or expected protection is implied by this example.
Hedges also involve prices, transaction costs, timing and sometimes borrowing or financing. A hedge that cannot be adjusted at the expected price can create its own liquidity problem. Offsetting economic exposure and completing the cash-and-securities transfers are separate tasks; the next lesson explains the latter.
Market making therefore combines trading decisions with operational capacity. Software failures, stale data or incorrect position records can affect the quotes a firm submits. Those risks help explain why the business cannot be evaluated solely by subtracting the displayed bid from the displayed ask.
Venue obligations: the NYSE example
US venue example, verified 4 October 2026. NYSE describes a designated market maker, or DMM, assigned to each NYSE-listed security, with responsibilities for fair and orderly markets and participation around openings, closings and imbalances. This is a particular exchange role, not a universal description of every firm that supplies liquidity. Source: NYSE equities market description.
The NYSE also describes parity/priority allocation, under which price-setting priority and participation at a price are handled differently from a simple first-in queue. That affects how eligible interest competes for incoming orders. It does not grant the DMM an ability to determine the security's fundamental value or guarantee each customer's result. Source: NYSE parity/priority explanation; verified 4 October 2026.
By comparison, Nasdaq describes its stock market's continuous model as price/time priority. This comparison is enough to show why a statement about “the market maker's place in the queue” needs a named venue and relevant order conditions. The detailed operating rules, not a generic title, determine the role. Source: Nasdaq stock market description; verified 4 October 2026.
A quoting obligation should therefore be read with its scope: which security, which session, which market state, what size and what exceptions? This lesson does not reproduce a rulebook or state that one set of obligations applies everywhere. A formal obligation is also different from a guarantee that all desired trades can occur at an unchanged price.
Market making, fast trading and order routing
Market making is a function; high-frequency trading describes a family of technology-intensive trading methods. They overlap, but neither term completely defines the other. A fast firm might submit quotes, execute against stale quotes, or perform other activities. Identifying speed does not tell you whether a particular order added or removed liquidity.
Likewise, an exchange provides a market structure within which participants trade; it is not interchangeable with a market-making participant. A broker handles a customer relationship and instructions. A business group may encompass several functions, but an explanation should identify the role relevant to the event being discussed.
Some US retail orders execute through off-exchange dealers. FINRA's description of execution venues distinguishes that activity from exchange and alternative-trading-system executions. A dealer appearing as counterparty does not, by itself, show whether the customer obtained a good or poor execution. Source: FINRA, Where Do Stocks Trade?; verified 4 October 2026.
The existing payment-for-order-flow lesson addresses routing incentives. The distinction to retain here is between compensation for receiving flow, the risk of executing that flow, and the quality of the resulting customer fill. Treating those as one number conceals the relationships that need examination.
When liquidity becomes less dependable
In stressed conditions, participants may be less willing or able to hold inventory. Price uncertainty can rise while funding or risk capacity becomes tighter. Those forces can reduce displayed size or widen quotes. BIS research discusses such mechanisms in fixed-income market making; it supports the general distinction between inventory capacity and available liquidity, not a numerical forecast for equities. Source: BIS, Shifting tides, March 2015; reviewed 4 October 2026.
Imagine the same dealer faces twice as many incoming sells while its allowed inventory capacity stays unchanged. Once it approaches that capacity, continuing to buy the same quantity at the same terms would require a change somewhere else: a sale, more capacity, a hedge, or a different risk decision. The original quote cannot be assumed to remain available merely because it was visible earlier.
This is an accounting constraint rather than a prediction that every stressed market must follow one path. Other participants might step in, news might resolve uncertainty, or an auction might gather offsetting interest. Conversely, many participants may want to reduce exposure at once. The outcome depends on the system's actual condition.
A reader should also separate market liquidity from funding liquidity. The first concerns the ability to transact securities; the second concerns obtaining cash or financing when needed. They can interact: a firm unable to finance inventory may quote less capacity. BIS's discussion of these concepts treats them as connected but distinct. Source: BIS, Market and funding liquidity, May 2016; reviewed 4 October 2026.
Interpreting claims without inventing motives
Suppose someone presents a chart showing price falling immediately after a dealer purchase and concludes that the dealer “wanted” the decline. The first worked example shows why that inference can be backwards: a long position can lose from the decline. Without its full inventory, hedges and other trades, the chart does not establish its net exposure or motive.
Conversely, a rising dealer revenue figure would not prove every customer received an unfair execution. A customer can value immediate execution while a dealer accepts the associated inventory risk. Whether actual conduct met applicable obligations is an evidence-based question about the relevant records and rules, not a conclusion contained in the words “market maker.”
For learning purposes, four questions make a claim more precise: What quote and size were available? Which side actually executed? What inventory and cash remained? What changed before the offsetting transaction? The two worked examples answer these explicitly; many confident social-media explanations do not.
Key takeaways and next lesson
- A two-sided quote offers prices and quantities; it does not certify value or future execution.
- The quoted spread becomes a gross round-trip difference only if the relevant transactions actually occur.
- Inventory risk and adverse selection can offset or exceed that difference.
- Spread, depth, turnover and ending inventory measure different things.
- Venue-defined obligations and fast trading methods should not be confused with universal guarantees.
Continue to Clearing and Settlement. Once a dealer and another participant have agreed a trade, prices on a screen are only part of the story. Cash obligations, securities delivery, recordkeeping and the settlement calendar still matter.
Sources and revalidation
The linked NYSE, Nasdaq and FINRA descriptions were verified on 4 October 2026 and apply only to their labelled US examples. Recheck them after changes to participant obligations or matching and routing procedures. The BIS publications are dated explanatory research, not claims about current spreads or dealer balance sheets. All arithmetic and diagrams here are original hypothetical teaching examples. No profitability, market-share or execution-quality statistics are asserted.
Finished this lesson? Track your progress.
Frequently asked questions
Do market makers always earn the spread?
No. Earning the quoted spread requires compatible completed trades. Inventory price changes, adverse selection, hedging and operating costs can offset or exceed any gross trading margin.
Does a market maker control the price?
A market maker controls its own submitted quotes within applicable rules. Competing interest, incoming trades and new information also influence prices; the ability to quote is not control of the whole market.
Is every market maker an exchange?
No. An exchange is a venue with trading rules. A market maker is a participant that quotes and trades, usually as principal. A group can have multiple business functions, but the roles remain distinct.
Does a liquidity obligation guarantee my order will fill?
No. Obligations depend on venue, security and circumstances. They do not promise every quantity at a fixed price, uninterrupted trading, or protection from losses.
Key terms
Next lesson
Continue learning
Clearing, Settlement and the Settlement Clock
Related topics
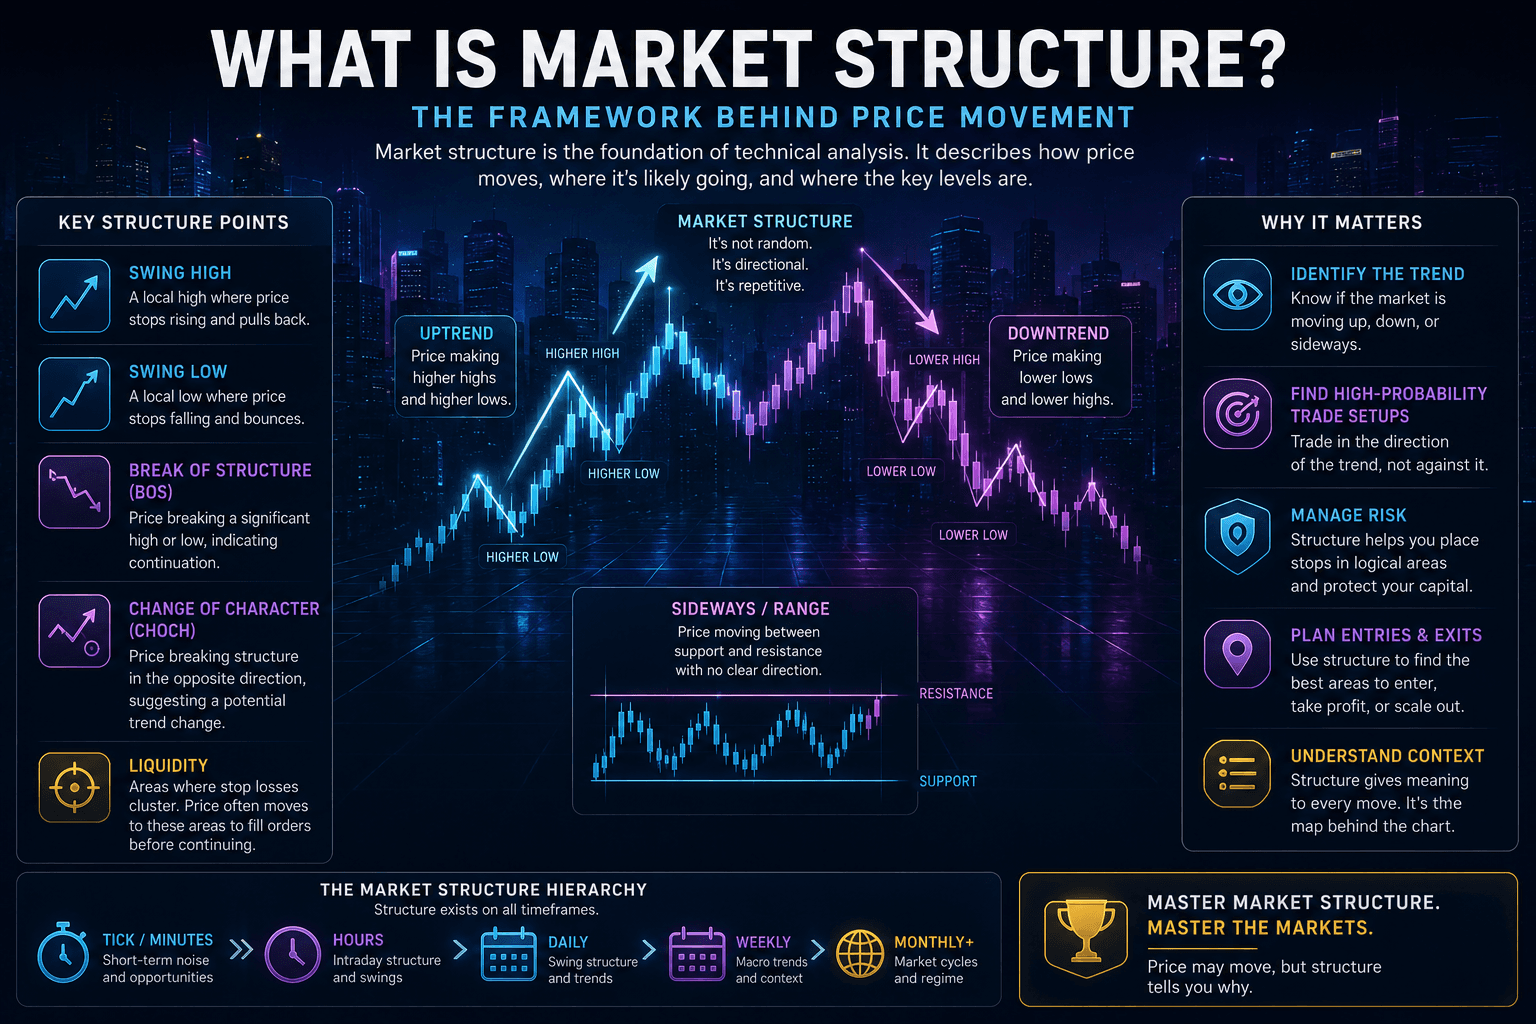
What Is Market Structure?
A guide to the hidden plumbing of the markets: the players, how a trade really travels from your tap to settlement, what the order book and liquidity mean, lit venues versus dark pools, and why it all affects the price you get.
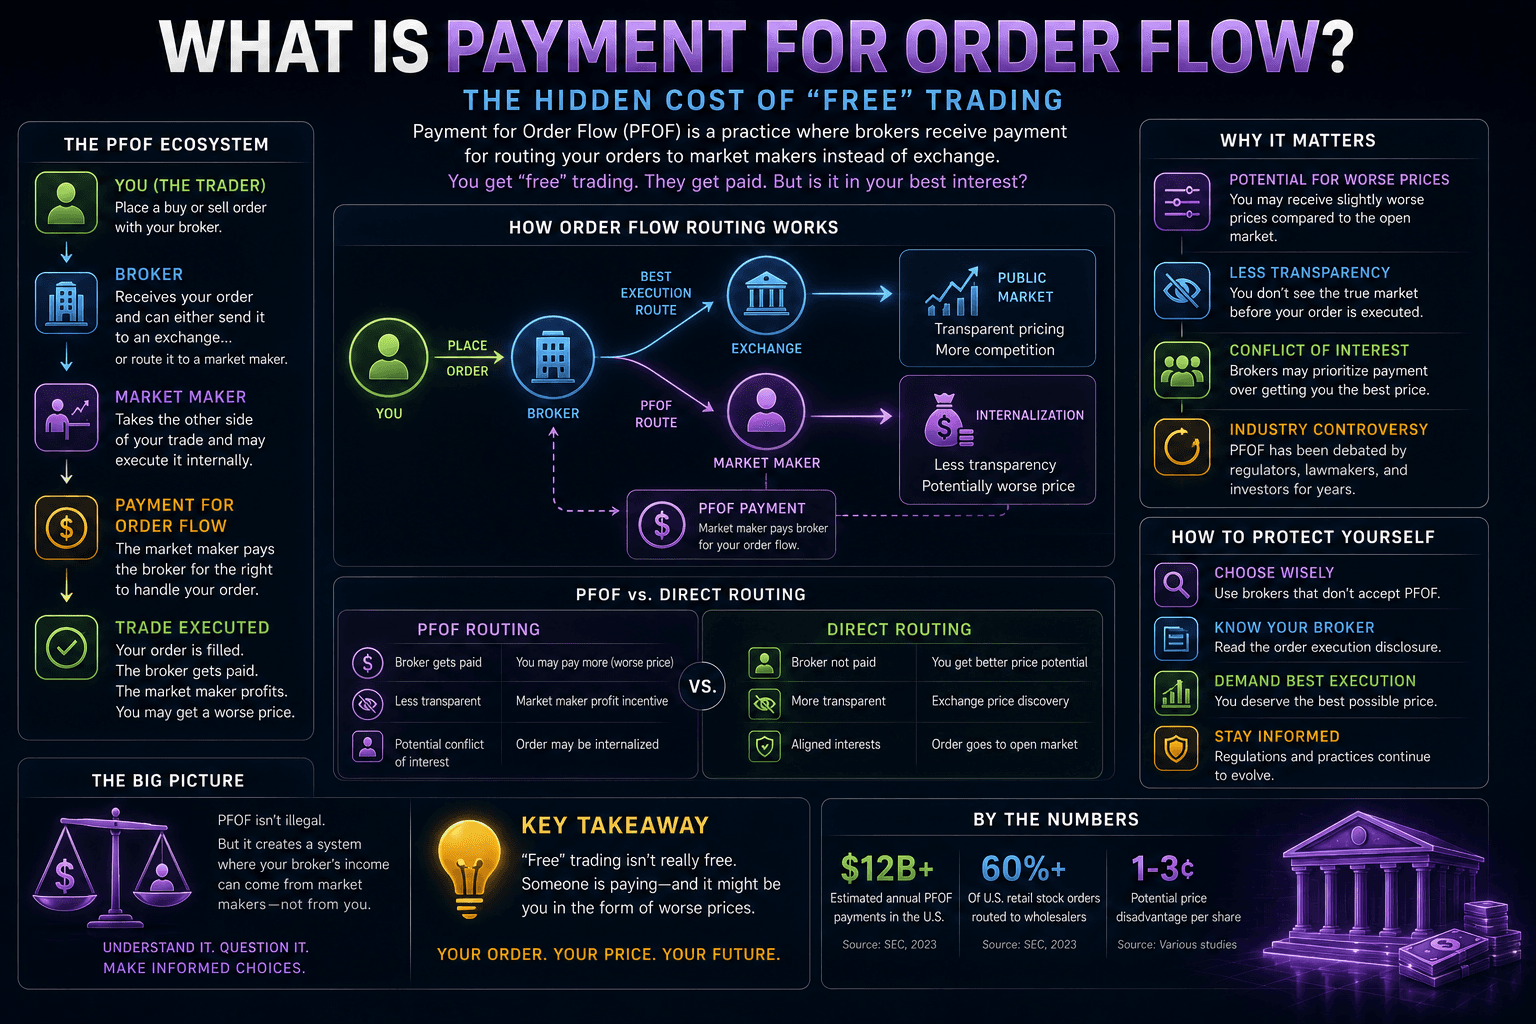
What Is Payment For Order Flow?
A balanced explanation of payment for order flow: how it funds commission-free trading, why market makers pay for retail orders, the conflict of interest it creates, price improvement and the NBBO, and what it means for you.
Liquidity & Liquidity Sweeps
In market-structure trading, 'liquidity' means the resting orders — mostly stop-losses — that pool just beyond obvious swing highs and lows, and that price is drawn toward. This article explains buy-side and sell-side liquidity, why equal highs and lows are magnets, the liquidity sweep (or stop hunt) where price spikes through a level to trigger orders then reverses, internal versus external liquidity, and how this framing relates to the classic false breakout.
Ironclad Research provides educational content only. Nothing on this platform is financial advice, a recommendation, or an offer to buy or sell any security. Always do your own research and consider professional advice before making financial decisions.