High-Frequency Trading (HFT): Speed, Orders and Liquidity
Understand what fast automated trading does, how latency affects order events, and why speed alone proves neither profitability nor market manipulation.
Written by James Lipyeat · Founder, Ironclad Research
Reviewed 10 October 2026 · Editorial policy
Before this, read
What the speed label actually tells us
High-frequency trading, usually shortened to HFT, describes trading activity organised around very short response times and rapid interaction with electronic markets. It is a useful label for a group of activities, not a complete explanation of what any particular firm does. Speed tells us something about timing. It does not automatically tell us the strategy, legal status, quality of execution or eventual profit.
This lesson explains general mechanics for a global audience. The cited SEC report concerns US markets; the cited BIS working paper studies a particular setting and research question. Neither is treated as a universal definition of every jurisdiction's rules. Sources were checked on 10 October 2026. All trading examples, timings, quantities and costs below are invented teaching assumptions, not live measurements or trading signals.
The prerequisites are exchanges and trading venues and market makers. Those lessons explain where orders interact and what supplying liquidity means. Here the additional question is how the sequence changes when information, decisions and order messages travel on very short timescales.
Automation, speed and function are separate labels
An algorithm is a set of instructions that a computer can implement. A program that divides a large order into smaller pieces over an afternoon is algorithmic. So is a program that responds to a quote change much faster than a human could click. The first description does not establish that the program competes in a latency race; the second does not establish that it supplies rather than consumes liquidity.
Market making is a function: quoting prices and accepting the possibility of holding inventory. An automated market maker may update prices quickly as information and inventory change. Another fast participant may submit an immediately executable order against those prices. Both can use sophisticated technology while occupying opposite sides of that particular interaction.
The SEC staff's 2020 report discusses algorithms across investors, brokers and principal trading, including their diverse uses rather than reducing them to one activity. Its conclusions belong to that historical US-market review. Source: SEC staff, Staff Report on Algorithmic Trading in U.S. Capital Markets, 5 August 2020; checked 10 October 2026.
It helps to ask three separate questions: what decision is automated, what timing matters, and what economic role is being performed? A firm name or the word HFT is not a substitute for those answers. A participant can also change roles across transactions, providing liquidity in one and taking it in another.
Latency is a chain of delays
Latency means elapsed time between specified events. In a simplified trading chain, market information travels to a participant, a program processes it, an order travels to a venue, and the venue processes the message. A response then travels back. Measuring only one part of that chain can produce a true number with a misleading interpretation.
For example, a program might calculate a decision in 20 microseconds but take much longer to receive the relevant information or deliver the resulting order. A microsecond is one millionth of a second. The precision of the unit does not mean the measured stages are identical across firms, instruments or venues.
Infrastructure choices can reduce some delays: proximity to a matching engine reduces part of the communication journey, while software design changes processing time. Neither removes every delay or gives a program knowledge of events it has not received. A message still has to arrive, be accepted and interact with the venue's actual state.
Latency can also vary rather than remain constant. Two routes with the same average delay might have different worst cases. In a time-sensitive process, an occasional long delay can matter even when the average looks small. A useful measurement therefore names its start and end events, its observation period and whether it is reporting an average, a percentile or a maximum.
Worked example 1: two responses to the same update
Assume a fictional venue publishes an update at time zero. Participant A receives it after 30 microseconds, takes 20 to decide, then needs 40 to transmit a new order. Its order arrives after 90 microseconds. Participant B receives it after 45, takes 10 to decide and needs 55 to transmit. Its order arrives after 110 microseconds.
| Assumed sequential stage | Participant A | Participant B |
|---|---|---|
| Data travel | 30 microseconds | 45 microseconds |
| Decision processing | 20 microseconds | 10 microseconds |
| Order travel | 40 microseconds | 55 microseconds |
| Total arrival time | 90 microseconds | 110 microseconds |
B has the faster decision calculation but the slower end-to-end arrival. The example demonstrates why one attractive benchmark is not enough to compare complete systems. It assumes the stages are sequential and ignores queuing, network variation, validation and any other venue processing time.
Now add a different event: the owner of a resting quote sends a cancellation that arrives at time 80. Assume the matching engine processes messages in this stated order and removes the quote before A's order arrives. A is faster than B, but neither can execute against the quantity already removed. Faster than a competitor does not mean faster than every relevant event.
Change only the assumed cancellation arrival to time 100. A now arrives before the cancellation; B arrives after it. Whether A actually trades still depends on its price, quantity, order instructions and the available queue. The timeline narrows the possible sequence without supplying all the missing conditions.
A quote is an offer of liquidity, not a completed trade
A resting sell order can make shares available to a buyer at a stated price, subject to its conditions and the venue's rules. An arriving order can consume that quantity. A cancellation can remove it before execution. Those are three different message outcomes; counting messages as if each were a trade inflates the activity being described.
Consider a quote offering 100 shares at $40.02. An incoming order executes for 30, leaving 70 if no other conditions intervene. The original 100 was displayed quantity at a moment in time. The executed 30 is a transaction. The remaining 70 is potential availability, not an additional completed transaction.
A later cancellation of those 70 does not reverse the already completed 30 in this simple model. Nor does seeing the cancellation prove why it happened. A participant might be reacting to a changed price elsewhere, an inventory threshold, an error or another event. Identifying a legal violation requires the relevant evidence and rules; this lesson does not offer a shortcut from a cancellation count to an allegation.
Queue priority is another separate issue. A participant can arrive quickly and still sit behind existing quantity at the same price under the assumed matching rules. Different venues and order types can apply different priorities. The teaching timelines therefore state their matching assumptions rather than claiming that speed always wins every allocation.
What a latency race means in research
One research question concerns opportunities created when a price or reference changes and participants race to trade against, or cancel, a quote that has not yet adjusted. This is often discussed as latency arbitrage. It is a particular mechanism, not a synonym for all electronic execution or every market-making trade.
BIS Working Paper 955, published in 2021, uses exchange message data to study those races. Its methodological point is useful here: successful trades alone do not reveal all unsuccessful attempts competing with them. The authors examine messages that a more limited dataset can miss. Their empirical results concern the study's setting, not a current universal HFT market share. Source: BIS, Quantifying the high-frequency trading “arms race”, 4 August 2021; checked 10 October 2026.
Imagine five participants attempt to access a quote and only one succeeds. A trade file may show one execution. A richer message record could show the other attempts and the cancellation sequence. Those datasets answer different questions. The first can describe an execution price without reconstructing the full contest that produced it.
Even the richer record needs interpretation. Timestamps must be comparable, identifiers must be understood, and the researcher must define what counts as one race. A result can change when the sample, instruments or detection method change. Treating a precisely reported estimate as a timeless description of every market removes those necessary boundaries.
Worked example 2: spread revenue is not net profit
Assume a fictional participant buys 100 shares at $40.00 and later sells exactly those 100 at $40.02. Both legs complete at the assumed prices. The gross price difference is $2: 100 multiplied by two cents. If the explicit transaction costs for the complete round trip total $1.20, the remainder is $0.80 before other costs.
That exercise is deliberately conditional. It does not say the second leg was available when the first occurred, that every attempted round trip completes, or that the participant can repeat the result indefinitely. It also leaves out infrastructure, data, staffing, financing and other expenses. A narrow displayed spread cannot be read as a participant's guaranteed income.
Change the assumed sale to $39.97. The gross result becomes a $3 loss, and the same $1.20 explicit costs produce a $4.20 loss. The program could have submitted both instructions quickly and still lost money. Speed does not prevent a position's value from changing while it is held.
Now suppose only 60 of the 100 shares sell at $40.02. The realised gross difference on those 60 is $1.20, while 40 shares remain. Reporting the original full $2 spread as realised profit would be incorrect. The unsold inventory requires its own valuation and could later gain or lose value. Partial completion matters as much as the quoted prices.
These examples explain the distinction between a displayed opportunity, an executed position and a completed economic result. They are not return estimates, a backtest or instructions for competing with specialist firms.
Liquidity has more than one dimension
A quoted bid–ask spread measures the gap between specified buy and sell prices. Depth describes quantity available at particular prices. Price impact concerns how execution changes the prices encountered or subsequently observed. Resilience concerns how market conditions recover after disruption. A statement that “liquidity improved” needs to identify which of these it means.
Assume Venue X initially quotes $49.98 bid and $50.02 ask, with 1,000 shares at the ask. Later it quotes $49.99 bid and $50.01 ask, with only 100 shares at the ask. The spread has narrowed from four cents to two, but displayed ask-side depth has fallen. Neither number erases the other.
A buyer of 50 shares and a buyer of 500 shares do not face the same depth question. If the later book offers 100 shares at $50.01 and the next 400 at $50.05, a hypothetical 500-share purchase costs $25,021, averaging $50.042. That is higher than buying all 500 at the old assumed $50.02 ask, which would cost $25,010. Ignore fees and changes during execution for this comparison.
Normal conditions and stress can tell different stories
Fast quoting can help prices respond to information, while rapid interaction can also transmit a disturbance or remove availability quickly. Which effect dominates is an empirical question about particular behavior and conditions. A model in which every participant keeps quoting through every shock has assumed away a central risk rather than disproved it.
The SEC staff's 2020 overview reports improvements in several market-quality measures under normal conditions, alongside evidence that some algorithmic activity can worsen unusual stress. That is a conditional summary of research, not a verdict that every fast strategy always helps or always harms. The report also discusses operational failures and interconnected markets. Source: SEC staff report, overview and sections IV.D–IV.E; verified 10 October 2026.
For a teaching scenario, suppose several participants react to the same volatility threshold by reducing size. No one needs to agree with anyone else for available quantity to fall together. Alternatively, a participant could keep quoting while others step back. The label HFT alone cannot tell us which response occurred.
Operational risk adds another layer. A program can implement an incorrect instruction consistently and very quickly. A stale input, misunderstood instrument identifier or failed connection can affect a sequence of orders before a person intervenes. Testing, monitoring and controls are therefore part of understanding automated markets, not evidence that automation eliminates error.
Reconstruct a small message log
A fictional log can make the distinction between intent, instruction and outcome concrete. Assume a venue receives a sell order for 200 shares at $25.00 and accepts it into an otherwise empty ask queue. It then receives a buy instruction for 80 shares that can trade at that price. Under these assumptions, 80 execute and 120 remain available from the sell order.
Next, the seller sends a request to cancel the rest. Before that request reaches the venue, another eligible buyer reaches the quote and executes 50. When the cancellation finally takes effect, it removes the remaining 70. The ledger is 80 executed plus 50 executed plus 70 cancelled, accounting for all 200 original shares of offered quantity.
The seller's screen might have shown a cancel request before it received the second fill report. That local screen sequence does not establish that the venue processed the cancel before the second execution. The time an instruction is sent, the time it is processed and the time its acknowledgement is received are different events.
The accounting check is simple, but the interpretation is important. A sent cancellation is not a guarantee that every remaining unit has already been removed. Equally, a later message on a screen is not necessarily a later event at the matching engine. A reliable reconstruction uses the meaning of each timestamp rather than sorting unlike timestamps as though they all measured the same clock and event.
Suppose a summary counts four instructions in the example: the original sell, two buys and the cancel. That is not four completed trades. There are two executions in this deliberately simplified log. Real data can split one instruction into several fills or contain additional acknowledgements and updates, so a raw message count needs even more careful interpretation.
Nothing in this exercise identifies an HFT firm or proves misconduct. It demonstrates a mechanism that can occur in electronic order handling. Classifying participants or evaluating compliance requires evidence absent from the invented log.
The comparison that a speed claim leaves out
Consider two fictional system reports. One advertises a 10-microsecond calculation time, measured after a complete data packet is already in memory. The other reports a 100-microsecond round trip, including outbound transmission, venue acknowledgement and the response journey. The first number is smaller, but the measurements are not comparable. Subtracting them would not quantify a competitive advantage.
Even comparable averages are not the whole distribution. Suppose Route A takes 50 microseconds in nine out of ten invented observations and 550 in the remaining observation. Its average is 100 microseconds. Route B takes exactly 100 in all ten observations, producing the same average. Under a hypothetical 200-microsecond deadline, Route A misses once and Route B never misses in this tiny constructed sample.
That does not make B universally superior. A different objective could care about the many occasions on which A is faster, and a real measurement would need far more observations and a justified sampling method. The example shows what an average leaves out, not how to select trading infrastructure.
Capacity is another omitted dimension. A system's measured delay under light traffic need not describe its delay when many messages arrive together. If queues form, the time before processing begins can dominate the calculation itself. Reporting both the workload and the measurement boundary makes the claim more useful than quoting an isolated record time.
These distinctions help a reader evaluate promotional statements without needing to build a trading system. Ask whether the reported number includes information arrival, whether unsuccessful requests are counted, and which traffic conditions were observed. Precise units improve a claim only when the underlying measurement is clearly defined.
How to read an HFT claim critically
Start with the unit being counted. Messages, orders, executions, shares and dollar volume are not interchangeable. A high message count could include many updates to relatively little eventual traded quantity. A volume percentage could use one side of each execution or a different counting convention. Without a denominator, even a precise percentage can be uninterpretable.
Next identify the comparison. A study might compare instruments, time periods, venues or a specific rule change. Each design addresses a different question. A result about one instrument's spreads does not automatically establish the outcome for a large order in another market. A statement about an average can also hide conditions in which the effect reverses.
Finally distinguish observation from intent and mechanism from prediction. An order book shows what was available or executed within its scope. It does not reveal every participant's objective. A mechanism showing that latency can affect allocation does not prove that a particular chart reversal was engineered, nor predict the next one.
The useful outcome of this lesson is a more precise reading of market events: specify the activity, reconstruct the timing, identify the quantity and measure the result under stated assumptions. For the next stage of the transaction, clearing and settlement explains why a fast execution is still distinct from completing the transfer of cash and securities.
Finished this lesson? Track your progress.
Frequently asked questions
Is high-frequency trading the same as algorithmic trading?
No. Algorithmic trading includes many automated decision and execution processes. HFT concerns activities organised around very short response times and rapid order interaction; a slow automated schedule need not be HFT.
Are all market makers high-frequency traders?
No. Market making describes supplying quotes and taking inventory risk. HFT describes fast trading activity. Some firms do both, but neither label establishes every activity or obligation of a firm.
Does HFT always improve liquidity?
No universal claim follows. The effect depends on the activity, market conditions and measure, such as spread, available depth or price impact. Evidence from one sample is not a promise for every market.
Does a cancelled quote prove manipulation?
No. Cancellation can reflect changing information, inventory or risk. Determining misconduct requires evidence about the conduct and applicable rules; a chart or cancellation count alone does not establish intent.
Does faster order arrival guarantee a profit?
No. Arrival, acceptance, execution and profitable completion are different events. Prices can change, orders may not fill, and trading, infrastructure and risk costs remain.
Key terms
Next lesson
Continue learning
Clearing, Settlement and the Settlement Clock
Related topics
Liquidity & Liquidity Sweeps
Learn the difference between market liquidity and chart-based liquidity sweeps: spreads, depth, price impact, buy-side and sell-side terminology, and what a price chart cannot establish about orders or intent.
Dark Pools & Alternative Trading Systems
Separate US trading-venue rules from order visibility, trace two hypothetical executions, and understand what dark-pool data can and cannot reveal.
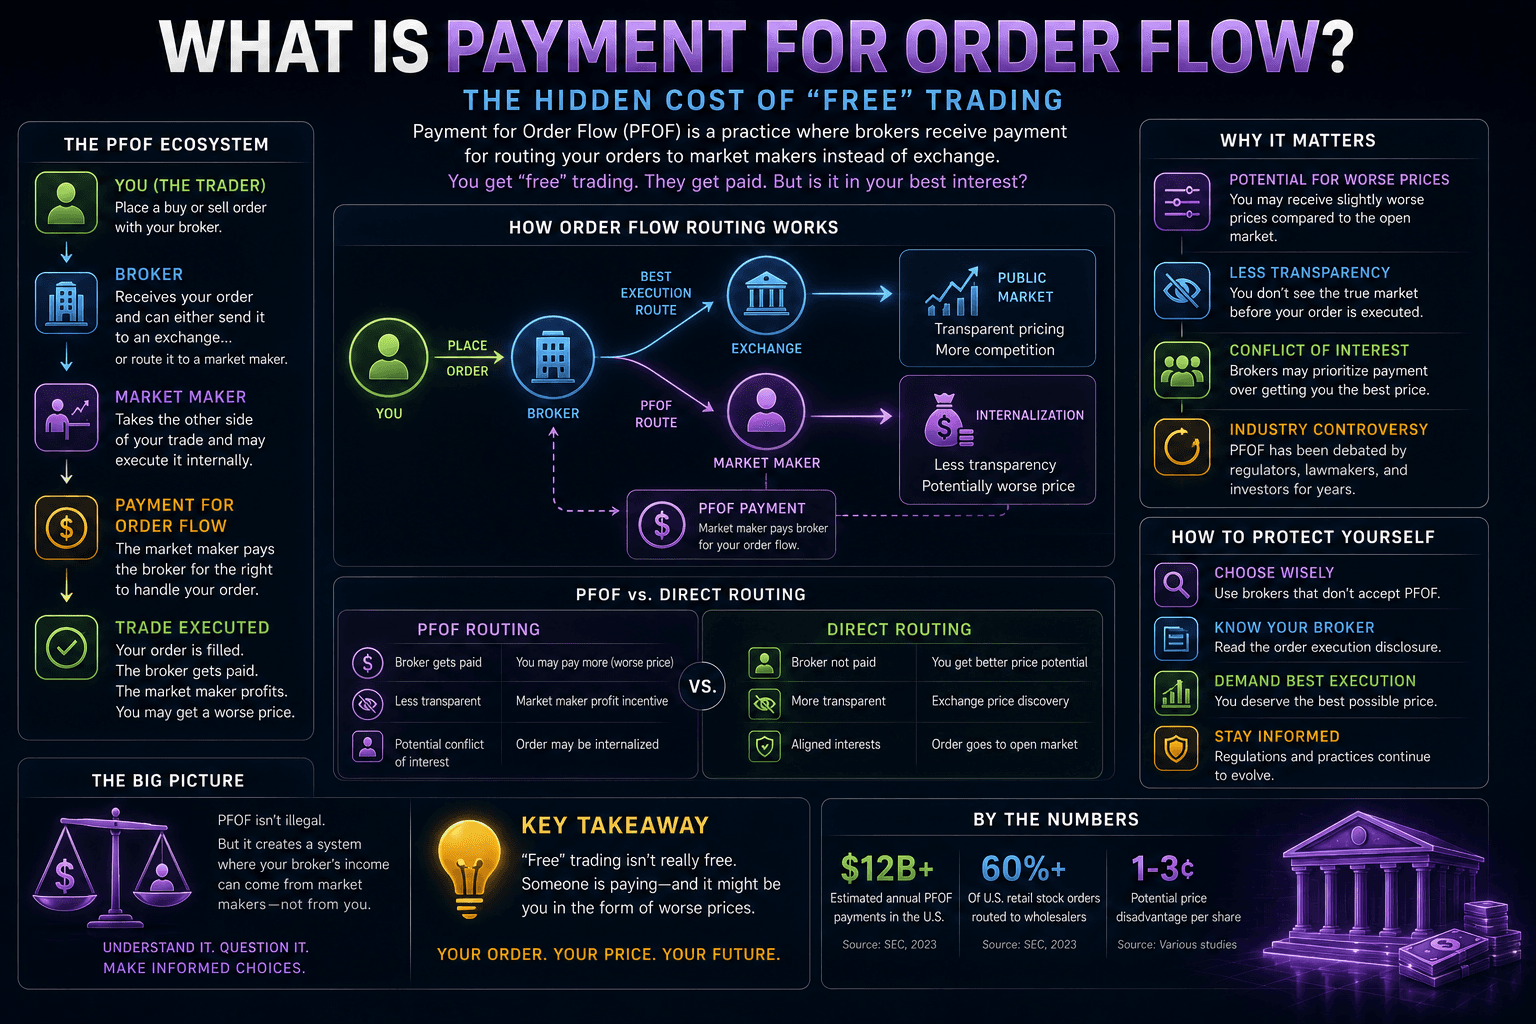
What Is Payment For Order Flow?
A balanced explanation of payment for order flow: how it funds commission-free trading, why market makers pay for retail orders, the conflict of interest it creates, price improvement and the NBBO, and what it means for you.
Ironclad Research provides educational content only. Nothing on this platform is financial advice, a recommendation, or an offer to buy or sell any security. Always do your own research and consider professional advice before making financial decisions.